Photo 137123877 © Charlottep68 | Dreamstime.com


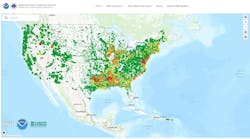
water.noaa.gov
Fred Greaves / California Department of Water Resources
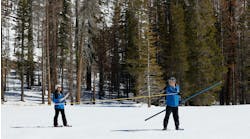
Photo 171374827 © Joergspannhoff | Dreamstime.com

Photo 45833406 © Kenishirotie | Dreamstime.com

Photo 60969407 © Hin255 | Dreamstime.com

Wright Water Engineers
Photo 59441063 © Rawpixelimages | Dreamstime.com


Invisible Structures
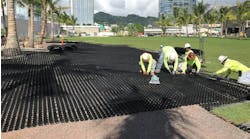
Photo 1649427 © David Kay | Dreamstime.com
Photo 25876 © Tomislav Stajduhar | Dreamstime.com
Photo 153841418 © Kevin Ruck | Dreamstime.com

Photo 39297166 © Mike2focus | Dreamstime.com

Sponsored Content
Photo 140820417 © Susanne Fritzsche | Dreamstime.com

Photo 11842769 © Judy Kennamer | Dreamstime.com

Photo 43114609 © Joshua Gagnon | Dreamstime.com


Home
Stormwater P3s - A Partnership for Resilience
Nov. 18, 2022
